Pages

Saturday, 20 June 2020

What Capita's proposed sale of SIMS means for the UK MIS market

Disclaimer: I have past, present and (hopefully) future commercial relationships with most of the UK's MIS vendors. Nonetheless I always try to write this blog impartially - my aim is to comment on the market from a neutral perspective; not to pick sides. If you have questions about this analysis, or any other blog, contact me on TwitterLinkedIn or via email

Yesterday Education Investor announced that Capita are eyeing the sale of SIMS [paywall]. According to the trade publication:
"Capita will look to sell its education software solutions (ESS) unit for at least £500 million as the listed business services provider’s board this week prepares to approve an auction, EducationInvestor Global can exclusively reveal."
(SIMS is the main asset in the ESS division.)

The article contained a range of interesting nuggets, including the fact that ESS generates EBITDA of £50m a year, and that Capita is hoping for a price-to-earnings multiple of 10-14. I hadn't seen a profit number for ESS before: Capita's group 2019 accounts don't provide that level of granularity, but they do report an overall operating adjusted operating profit of £306m on £3.65b of revenue, and the performance of the broader software unit was reported as a profit of £103m on £375m of revenue. The one number we're missing is the percentage of Capita Software's revenue that is generated by ESS, but helpfully this Capita investor presentation gives that as 26% of the total in 2017. So, assuming no significant change in the breakdown since then, it's fair to assume ESS has revenues of c. £100m.

This means we can extrapolate that:

  • Capita ESS makes c. £50m of profit on £100m of revenues.
  • ESS accounts for under 3% of Capita's revenue (100m / 3670m) and 16% of profits (50m/306m).
  • ESS comprises around a quarter of the software unit's revenue (100m / 375m) and almost 50% of its profits (50m / 103m).

In other words, however you look at it, ESS is a cash cow.

So what should we deduce from recent developments? Here are my thoughts.

  1. Capita think they'll generate more value from selling SIMS than from retaining it. That may sound self-evident, but the numbers are striking. The company thinks they can get £500-700m from the sale. The entire group market capitalisation as I write this is £719m, and the enterprise value (i.e. the company's total value, including debt and suchlike) is somewhere in the region of £2.2bn. So, yeah, I can see how you'd be ok with giving up 16% of profits in return for a fee that equates to 22-32% of your enterprise value, and 70-97% of your market capitalisation. Or, to put it another way, if your group price/earnings ratio is barely above 3, you might be happy to sell one of your bits for a p/e ratio of 10 or more - particularly if you're holding a lot of debt that you'd like to repay.
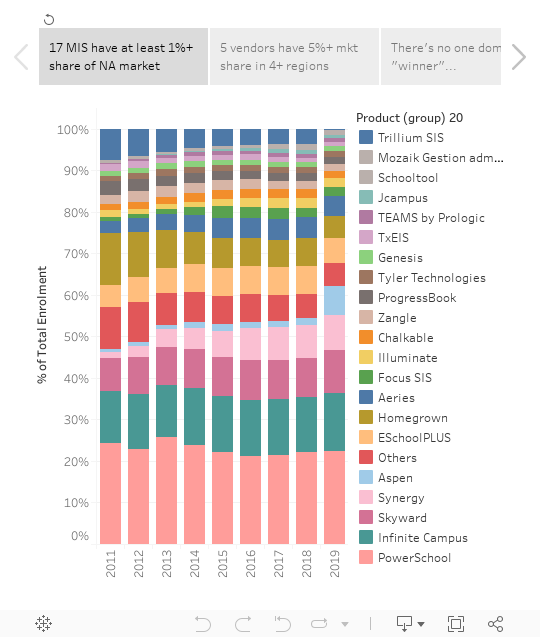
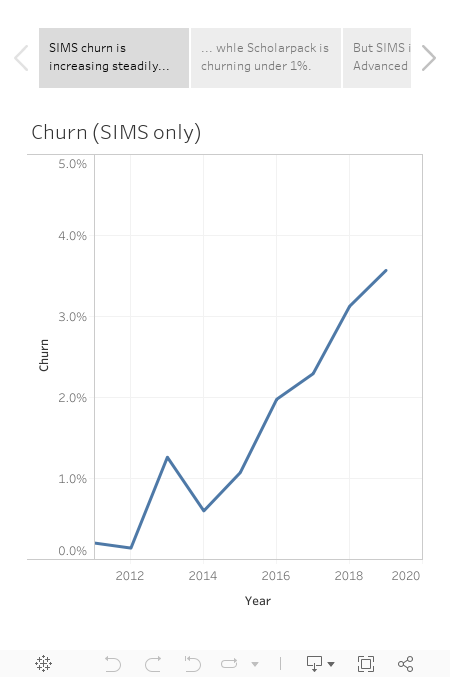
  2. SIMS' churn may have unsettled Capita. In my blog about 2019 MIS market moves, I included a chart of SIMS churn in English state schools (% of customers leaving year on year). It shows that churn has grown pretty steadily from 0.1% in 2012 to 3.6% in 2019. That's still not anything to be ashamed of, but the result is that SIMS market share when measured by # of English state schools declined from 83% to 75% between 2015 and 2019. 
  3. Capita are happy to let someone else manage the move to the cloud. The main business within ESS is still SIMS 7 - the locally hosted form of SIMS - which has traditionally been sold via local authority support units. Capita have been trying to move SIMS to the cloud for the best part of a decade - first with a pilot project for Northern Ireland that was shelved, and then more recently with the SIMS Primary initiative that was launched at BETT in January 2018. ESS doesn't publish numbers on how many schools have yet made the move to cloud, but we can infer that usage is still very limited from the fact that the SIMS Primary website offers users a chance to register interest to be "the first to know when it's available". The future success of SIMS will of course be bound up in the success of its cloud offering, but clearly Capita are perfectly happy to let someone else manage the headache of how to make the move. 
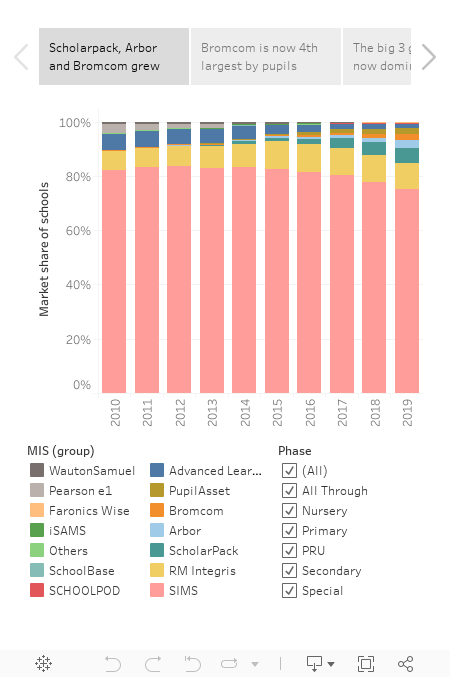
  4. SIMS' margins may be hard to sustain. However they've managed to price SIMS historically, the key thing to understand margins in the future business is the cloud pricing. And, happily, there is a way of doing just this, since all major MIS vendors now publish a version of their cloud price list on G Cloud, the government's procurement portal. SIMS's cloud offering is still only available for primaries, so let's focus on primary pricing. Using SIMS Primary's G Cloud entry we can see that an average primary of 290 students would pay £4,412 per year for the core software. I calculate the G Cloud cost for comparison of their leading competitors (ScholarPack, Arbor, Bromcom and Pupil Asset) as between £2,370 and £2,865. Now, I should stress, this isn't close to a perfect like-for-like comparison - the range of features included in the list price varies wildly, so the total cost of ownership may be quite different from these headline numbers. But even with those caveats, Capita does look more expensive. That may have been acceptable to customers of the locally hosted product, but in cloud-world SIMS is kind-of the challenger, given the successful cloud businesses that surround them. And with that positioning, they may experience downward pressure on prices from the competition.
  5. Capita has needed cash. Its competitors don't (yet). Capita's challenges over the past two years were well-publicised, and I'm hardly the right person to add any further commentary. However, what I assume is that as a result, Capita would be keen to generate cash, either by way of profits or selling assets at a good price. At the same time, they're now entering a phase of MIS competition where the competitors appear to be less focused on profitability. Take Arbor (currently the fastest growing challenger) as an example. They recently published accounts, which showed an EBITDA loss of £1.9m (taking into account amortisation, depreciation and exceptionals) on £3.1m of turnover. So maybe an onslaught of investment from competitors makes Capita more open to selling.
  6. School may not care that much about market rumours... While all this is fun for market watchers, the typical school is unlikely to care that much. One helpful historical defence of SIMS' market share has been how schools procure. Traditionally, the Local Authority entered into contracts with vendors - usually SIMS - and then they (or linked support units) resold licenses to schools. That meant that the typical LA school was unlikely to "go rogue" and buy their own MIS outside the LA's arrangement. Equally, LAs could benefit from the arrangement; support units were at liberty to add a margin on when reselling licenses, and the local support teams were often liked by schools. As a consequence, I'd be surprised if there were many individual schools planning to change their MIS buying decisions based on press rumours about SIMS' parent company. While I like to pore over this stuff on my weekends, the typical school head has better things to do.
  7. ...However, Multi Academy Trusts and SIMS support units might. These days there are market forces beyond the opinions of LAs and individual schools. First, Multi Academy Trusts (MATs) have become a thing, and they procure differently. Unlike individual schools, increasingly MATs have senior leaders (procurement managers, IT directors, data people and education teams) with the bandwidth and market awareness to run rigorous procurement exercises. Furthermore, challenger vendors have been successful in building functionality that appeals to MATs. That has contributed to a decline in SIMS' market share with MATs (69% in 2019 vs 75% for all English state schools) - and the people who have overseen those switches are more likely to notice ownership uncertainty than stretched staff in individual schools. Then, even the traditional SIMS Support Units are increasingly arms length or standalone businesses, and they may feel unsettled by the potential for change in how their main (and often sole) partner operates. As a consequence, this news may make them more likely to explore other options and start supporting challenger MIS in a way that leads to further choice for schools that are still part of LAs. Mind you, I could also imagine it going the other way: if Support Units have been frustrated about recent developments at Capita (and the slow rollout of cloud SIMS can't have been fun for them) then maybe a sale would seem like a positive development. 
Thanks to Ed Tranham of The Assignment Report (great education journalism), Chris Kirk of CJK Associates (high quality education strategy consulting), Nick Finnemore of Finnemore Consulting (equally awesome education product and strategy consulting) and Richard Taylor (legendary education entrepreneur who is never shy around an opinion) for conversations, emails and links that helped me to write this blog.

25/06/20 UPDATE: Since I wrote this piece Capita have released a press release on the planned disposal of ESS, which can be found here.

25/06/20 UPDATE: This blog was edited to consider the enterprise value as well as as the market capitalisation in terms of the potential sales price for SIMS.

Monday, 13 April 2020

Faronics Wise: a new(ish) entrant to the English MIS market

When I'm asked what advice I'd give to a company wishing to gain a foothold in the English MIS market in 2020, my response is usually something along the lines of "start at least five years ago, or buy someone who did".

It's not that you couldn't start now. But, you know, it's really hard to get your name out there! Schools generally aren't spending every day pondering their MIS choices; if they were, it wouldn't be the case that the highest churn we've seen in the market over the past decade is a whopping (drumroll)... 4%! At that rate, schools change their MIS at the glacial pace of every 25 years.

That said, we do now see a strong slate of challenger MIS picking up market share... but it's been a slog. The biggest winners of the past three years (Scholarpack, Arbor and Bromcom) have all been  refining their offer since at least 2012, and if you speak to the people who made that happen, none of them tells you it's been a doddle. But still, over time they each found their niche, and kudos to them for that. They picked a strategy, executed on that strategy, and kept banging on about it until eventually, one day, schools started to hear it and believe it and felt confident enough to make the switch. But nobody has found a short-cut to that process; rather, it would appear that those MIS with the clearest differentiation and a consistent long-term strategy have ended up with the greatest traction.

Anyway, this isn't supposed to be a blog about the wider market. Instead I'm writing about a new(ish) entrant, because a few days ago I had my first catch up with Chris Stockley, who oversees the commercial side of Faronics Wise. Before the chat I really didn't know too much about them, and so I thought I'd summarise what I learned for anyone similarly in the dark.

But first, allow me one more piece of preamble. I've said this before, but I should reiterate that I don't see it as my role to pick winners in the MIS market. Though these days I do have friends and clients within the MIS world, this blog will always aim to shine a light on the market while remaining studiously neutral. So what follows isn't an endorsement of this (or any) particular vendor; rather, it's a little bit of information about a new player, which may be of use to those who don't yet know about them.

So, who are Faronics? Well, they're a Vancouver-based technology company and a global player in classroom management software (the kind of thing that Impero and NetSupport do). They employ over 100 people and the CEO, Farid Ali, has led the company since founding it in 1996. Chris says that this corporate structure allows them to be patient.

Clearly that patience has come in handy, as Chris tells me he's been working on the rollout of the product for a full five years now. That came as a pleasant surprise to me, since in the latest English market stats they only have one school customer. Clearly, Faronics have been playing the long game: despite the extended development lead time, they only chose to launch the product at BETT 2019, once the census reporting module was ready.  Chris also points out that they have had notable successes elsewhere, and particularly in the international market, where they have 1m system users (80% of which are in Europe). I'm also told they have almost 200 English language schools in Spain alone.

Importantly, Faronics have spent that time refining their product-market fit for English state schools, and it looks like they've found a niche. They showed up on my radar in 2018 with that first English state school: Cranbury College, a Pupil Referral Unit (PRU) in Reading. Chris tells me that this choice was no accident - they have been focusing on the needs of PRUs, Alternative Provision (AP) and Special schools in particular. They're interested in other types of schools, of course: the international schools are all-phase, and Chris talks about functionality they hope will resonate with English primaries, like formative quizzes and their parent-school portal. But still, a lot of time seems to have gone into building the behaviour module (see screenshot below), which sets them up as an intriguing competitor to SchoolPod, Arbor and RM Integris, who are the strongest cloud vendors in the PRU / AP part of the MIS market (77% of cloud MIS share between them, and 22% of total share; SIMS is on 71%). Chris also says their cover module - which has features like managing cover when staff are teaching remotely in hospitals - is popular.

Screenshot of Faronics behaviour module
Another intriguing detail was that Chris says they're actually already working with 22 schools in England. He expects at least some of these to show up on the census data soon, but explains the lag by saying that Faronics treat MIS switching as a project that happens over a period of time. I was also interested to learn that their product manager is Tom Guy, previously a publisher at GL Assessment with a background in SEN products. No doubt Tom offers useful experience when planning their Special school / formative assessment features.

Will Faronics succeed in the notoriously tricky English MIS market? Well, like I say, thankfully that's not my job to decide! But what I will say is that they appear to be a serious company with a long-term plan. I look forward to tracking their progres...

Monday, 3 February 2020

What the US can tell us about how mature SIS markets behave

This is part two in a series of two blogs written by Justin Menard and me using each other's datasets. His blog last week examined customer migration in the UK. This blog will look at what the north American market can tell us about how markets evolve. But before I get stuck in, let me quickly explain who we are and what we're up to.

I blog about UK Management Information Systems (MIS). Justin does the same for the US (where the same product is referred to as the School Information System, or SIS). That said, there are some key differences between us: 

  • Justin has to work harder to collate his data because I just use stats released by the government following freedom of information requests, whereas Justin has to collate his using all kinds of clever techniques.
  • Justin also covers other products (like the LMS) and countries (so many countries), whereas I'm a one-trick, UK-focused MIS pony. 
  • Justin has been far-sighted enough to turn his work into a thriving market insights company, called LISTedTECH whereas I just... blog for fun? 
What I'm saying is: Justin is who I want to be when I grow up. 

(I'm 41.)

Aaanyway, back to me. I've created a Tableau Story in the same house style I use to blog about the English market, but using Justin's North American data source. As always, I'll give you the interactive graphs first, then you'll find my analysis below...


So what can we see?

  1. A mature market probably doesn't include a single dominant vendor. In England, there's a big beast called SIMS, owned by Capita, with 75% market share. That's down from 84% in 2012, but still, you know, three quarters of a market is a lot. In North America, however, it's a very different story. As the viz on the first tab above shows, no vendor has managed to claim more than around 25% of the North American market in any year (Powerschool had 25.8% in 2013). Now, it's true that North America is a more competitive market than the UK, with over 30 vendors boasting 100,000+ pupils within their districts, compared to just seven or eight vendors with that scale in England. But still: the trend in the past few years has been towards a more mature market, with greater competition for SIMS's crown, and the North American data suggests that may well continue.  
  2. That said, there's still space for local champions with majority market share. As my second viz shows, North America has notable variations at regional level. This is particularly true in Canada, where no region has more than four meaningfully-sized vendors, but it's also noteworthy that no more than seven or eight vendors compete in each of the three southern USA regions. We see similar patterns in the UK, where areas like Scotland and Northern Ireland basically procure a single system for the whole country. Also, even in competitive markets like England, regional champions have emerged, either via local authority group procurement, or (more recently) solid organic growth for local options like Pupil Asset in Norfolk. 
  3. It's quite hard to grow (or shrink) by more than 1 percentage point in a year. I mean you can... but to do so you're probably going to have to win (or lose) one very large contract, and there ain't many of those around. In North America, the biggest win of the past decade appears to be Aspen recently taking central Canada from Trillium, taking their overall North American market from 1.7% to 7.1%. But that's really the only move of anything like that magnitude I can find - and it followed eight years of steady decline for Trillium. In terms of what that says for the UK, it may make SIMS nervous about their ability to hold on to the Northern-Ireland-wide contract they've held for as long as I can remember. Or, to put it another way, just because you've locked down a market for a long time, it doesn't mean you'll keep it forever, particularly if your product trend-line is already downwards.
  4. It's hard to differentiate yourself in a mature market. My third viz shows the % of "won" contracts in a given year, and my main takeaway is "meh, nobody's really dominating the wins". My hunch is that this is a byproduct of how hard it is to differentiate yourself as a SIS. I once sat in a procurement beauty parade where the CEO of the commissioning group said to the vendor I was accompanying: "I've seen the red one and the blue one; now I'm talking to the white one. Tell me why I should remember anything else that's different about you?" The salesperson did a valiant job of responding, but honestly I wasn't convinced the CEO would remember the difference afterwards. Now, to be clear, I think there are meaningful differences between vendors, but I'm a nerdy market-watcher, and most commissioners aren't. So other than cloud vs non-cloud (yes, our dominant vendor in the UK is still locally hosted!), the data suggests that it's really hard to craft a marketing message that will win you more than a quarter of the available switchers.
  5. It's ok to be smaller, but you don't want to be one of the smallest. My fourth viz shows the losses by year, and what struck me was that the largest group in most years is "others". What this tells us is that the smallest vendors have struggled to hold on to their schools. I've given a vendor their own colour / segment if they have c.250,000 students (which is more or less the top 20 vendors in the market). In 2018 those 20 held data for 36m students, whereas the remaining long tail shared under 3m students. However, those smaller vendors represented fully one third of the losses in the year. My conclusion from this is that further consolidation - both in the UK and in the US - is likely. If you're a smaller vendor, you'll be looking nervously at the budgets and marketing clout of the bigger vendors, and every loss could feel like a threat to your survival. And equally, from the other side, those larger players may well be attracted by acquiring a ready-made chunk of market share in one go. Like I say, it's really hard to grow by even 1%, so if you can buy - say - half a percent of market share in one acquisition, it'll make a meaningful difference to your scale.

Finally, some brief notes and observations:

  • Justin's dataset is district-based, whereas my normal dataset is at the school level.
  • I've focused on % market share when visualising data as opposed to actual student numbers, because Justin has increased his national data collection coverage in every year, so the raw totals wouldn't necessarily offer a good like-for-like comparison.
  • As Justin pointed out in his blog, none of the US vendors has a UK presence. That's pretty wild when you consider how much edtech software does work both sides of the Atlantic.

For any questions about the data used for the graphs in this post, or to find out about subscribing to LISTedTECH's range of reports, please contact Justin use their website.

Monday, 27 January 2020

GUEST BLOG: Historical K12 SIS Customer Migration In The United Kingdom

You know what's a good feeling if you're a niche school data blogger? When people you admire agree to do reciprocal guest blogs with you, that's what! Which is a roundabout way of saying that Justin Menard, the Canada-based founder of LISTedTECH, has written the the following very cool piece about the English SIS market, and allowed me to post it here (you'll also find a copy on his blog). He has a way of visualising the movement of customers from legacy to new solutions that I think you're going to like - it helped me discover things I hadn't noticed before.

LISTedTECH measures and tracks systems used in educational institutions throughout the world - check out their website for more information. But for now, read on...
Back in November, I got the chance to meet Joshua Perry, writer of the “Bring more data” blog. Joshua has been following the Management Information System (MIS) used in the UK K12 market. Have a look at some of his posts http://bringmoredata.blogspot.com.
After discussing our mutual interests in educational systems’ market trends, we thought it could be interesting for the two of us to swap data and write a post using the other’s data. So this is my attempt.
Joshua's data is very granular. LISTedTECH looks at K12 data from the school district level, while he looks at it from the school level (using governmental data).
I created four historical graphs (2010-2014 to 2015-2019) of primary vs secondary level trends where every line represents a school. The left side shows the previous campus Student Informations System (SIS), measured by the number of institutions, and the right side shows the new SIS.
A few observations:
Primary level
  • Pearson e1, followed by SIMS, lost the most customers in the 2010-14 timeline.
  • SIMS, followed by Advanced Learning, lost the most customers in the 2015-19 timeline.
  • SIMS had the biggest customer increase in the 2010-14 timeline. However, they not only lost this advantage in the 2015-19 timeline, they actually came last as uptake in customers.
  • Overall, ScholarPack, RM Integris, and Arbor are the three companies with the most new customers within the 2015-19 time frame.
Secondary level
  • SIMS and RM Integris had the biggest customer increase in the 2010-14 timeline.
  • Advance Learning, followed by SIMS, lost the most customers in the 2010-14 and 2015-19 timelines.
  • Overall, SIMS and Bromcom are the two companies with the most new customers within the 2015-19 time frame.


Another interesting tidbit is that the systems used in the UK are completely different - as in I don’t recognize a single system used in the UK that would be used in North America.
A PDF version is available to help you zoom into the graphs.
For any questions about the data used for the graphs in this post, please contact Joshua Perry, writer of “Bring more data”.

Wednesday, 11 December 2019

UPDATED: 2019 election night - compare results to polls / 2017 election

(Updated on 11th December at 10pm to include 2017 GE election results)

I find that one helpful thing to do when watching election night coverage is to compare the results as they come in to the final (or most authoritative) poll. The networks don't really focus on that analysis; instead, they show you the swing from the last election, which is important, obvs, but not representative of where perceptions are on the night in terms of expectations of the likely result.

So I've made this Tableau tool, which allows you to look up a constituency's predicted vote shares from the second and final Yougov MRP poll alongside the 2017 General Election election results.


Thursday, 5 December 2019

MIS MARKET MOVES 2019: the challengers are slowly but steadily catching up

If you've found your way to my blog, you're almost certainly here for in-depth Management Information System (MIS) market analysis accompanied by whizzy graphs, and almost certainly not here for whimsical stories about random encounters in a veterinary surgeon's office in Lausanne.

But tough luck, because something bonkers happened to me yesterday in just that setting, and it's way more relevant to this blog than you'd imagine. So, if you haven't already, pause your excitement to find out about this year's market stats, check out this Twitter thread, and then come back here to read on....

[...]

Oh good, you're back. That was nuts, right?

Anyway, a brief headline of this year's stats is: yep, SIMS is continuing to decline, but nope, it's not happening as quickly as some vendors and commentators have been claiming.

Let's start with churn, since it's frankly the most important metric for understanding the pace of change in the market. Here are three charts that tell you what you need to know (commentary below):


Taking the charts in order:
  1. SIMS churned 3.6% of its school customers in 18/19, up from 3.1% in 17/18. Bear in mind also that this is the culmination of a steady uptick since 2014, when churn was just 0.6%. That's no doubt cause for concern in SIMS Towers, but given some people have been whispering predictions well in excess of this, it's by no means (yet) a sign of precipitous decline. 
  2. What you can see though, is that the market is inexorably changing in favour of the challenger MIS. The top two vendors (SIMS and RM Integris) churned 3.6% and 4.1% respectively, whereas the third (Scholarpack) is churning at under 1%.
  3. However, let's not get carried away. The third chart shows Advanced Learning's churn set against that of SIMS. Advanced are something of a parable of what not to do in MIS-land: they have declined from 1,380 schools in 2010 to just 357 today. (Note to self: the story of why that happened is in itself worth a blog someday.) Things looked fine for them in 2011, when they churned just 2.2% - but the canary in the mineshaft came in 2012 when churn jumped to 7%. It rose to over 10% in 2014, and it has been between 10% and 37% ever since. 
Or, to put it another way, the data implies that mature MIS can churn up to perhaps 5% and just about hold their own. So I'll sound the alarm for SIMS if and when that number gets above the 5% threshold.

OK, now let's move to the market more broadly. Here are a bunch more graphs (again, with analysis below):


You'll see from these that:

  1. SIMS market share is now at 75.1%, down from 77.8% last year when measured in terms of the number of school customers. (The decline is smaller than their churn because they won some schools too.)
  2. RM Integris remains in a clear second place, but also dropped a little (from 2,175 to 2,127 schools), giving further ground to the approaching pack.
  3. Arbor, Bromcom and Scholarpack all continue to gain, with each being able to claim an important distinction. Arbor grew fastest overall, notching up 277 switchers. Bromcom did best best amongst secondaries for the second year running (which also translates into a greater market share when measured by pupils). And Scholarpack remains the biggest of the three challengers on all measures, with 1,233 schools (5.6% market share by schools; 3.8% by pupils).
  4. Pupil Asset and Schoolpod stayed solid, without matching the gains of the other challengers. Pupil Asset grew the most, from 410 to 447 schools, and Schoolpod was more or less static at 134 schools vs 131 last year.
  5. SIMS's losses still are mostly primary-focused, though it's notable that they lost almost twice the number of secondaries in 2019 as they have done in any other year (53, compared to the previous high of 29 in 2018).
  6. Advanced continue to have a rough time. They gained just 10 schools in the year - the lowest of all MIS who won any schools, and lost 46. They're now the 7th largest MIS in terms of the number of school customers (357 vs 397 in 2018). 
  7. Nobody else is making a dent. iSAMS and SchoolBase held on to their handful of schools (they're both much bigger with private schools, mind), and Faronics are still there with one school customer. But nobody else is making a significant dent on the market, and it'll be jolly hard for anyone else to break in to the market now, given the years of hard work it took Arbor, Bromcom and Scholarpack to build their current momentum.

Right, that's enough for now. I may play around with a bit of additional analysis between now and Christmas, so keep an eye out if you'd like to hear more. Ideas are welcome!

Oh, and I recently left Assembly (my day job until earlier this month), and instead I am now:
  1. Starting a new schools venture (we're launching in January - watch this space).
  2. Representing Aircury, an awesome edtech software development agency.  
  3. Doing bits and bobs of advisory work. 
So, if you are struggling to resource your development needs, let's talk! Or, you're a MIS vendor and you'd like additional analysis, get in touch! Or, if you're an investor considering the market, hey, give me a shout! Or if you're a Multi Academy Trust considering what MIS to buy, cool, let's chat! (In the case of MATs I don't normally charge unless there's specific a need for lots of assistance - mainly I just enjoy gossiping about MIS....)

A final disclaimer: while I now have a few friends and/or clients who work for MIS vendors, I always aim to write this blog from a neutral perspective. As such, I generally avoid predictions, and instead focus on relating insights derived from the data. 

Wednesday, 31 July 2019

MIS switching picked up in the spring term. Arbor, ScholarPack and Bromcom led the way.

This is a quick blog update as I've just received the school summer census MIS numbers, and  there are some interesting points to note. But also... it's barely any time since my previous post based on the Spring census, so I'm not indulge in all the normal Tableau whistles and bells.

Instead, here are the headlines. Between the 2019 Spring and Summer censuses:

  • 420 schools switched MIS. That's a lot in historical terms for one term - and more than switched in an entire academic year between 2010-11 and 2013-14. 
  • 613 schools have switched so far this year. Last year 860 schools switched - itself the highest for a decade - and 2018-19 now looks on track to beat this.
  • Arbor, ScholarPack and Bromcom all did well. Arbor had the most switchers (125), followed closely by ScholarPack (115) and Bromcom (99). However, if you measure switching by pupil numbers, Bromcom was out in front (46,769 new pupils), followed by Arbor (34,790) and ScholarPack (28,008). 
  • SIMS lost 350 schools - a 2.1% churn. To put this in context, that figure (for one term) is higher than their churn in any full year over the past decade with the exception of 2017-18, when they churned 2.9%. Moreover, in the two terms of 2019 combined they've already churned 2.9%, meaning they're on track for another year of increased churn. Their market share (by number of schools) is now 75.8%, down from 77.3%.
  • Arbor is now the fourth largest vendor by numbers of schools; Bromcom is fourth largest by pupil numbers. The pecking order by schools is now: SIMS (75.8%), RM Integris (9.7%), Scholarpack (5.5%), Arbor (2.5%), Pupil Asset (2.0%), Bromcom (2.0%), Advanced (1.7%), SchoolPod (0.6%). By pupil numbers it's SIMS (79.9%), RM Integris (7.0%), ScholarPack (3.7%), Bromcom (3.0%), Advanced (2.6%), Arbor (1.9%), Pupil Asset (1.1%), SchoolPod (0.4%).
Below are the tables showing the Spring and Summer census 2019 figures for the raw data aficionados out there. If you have any other questions, say hi on Twitter or LinkedIn.