I've spent the last couple of weeks playing with the latest (Jan 19 census) school MIS data. When I
first tweeted about it my headline was "NOT MUCH CHANGED". That's because a relatively underwhelming 193 English schools switched MIS - so you'd be forgiven for assuming there isn't much happening in the market.
But then I decided to dig into the data and look at the effect of Multi Academy Trusts (MATs) on MIS commissioning, and I came across some eye-opening trends.
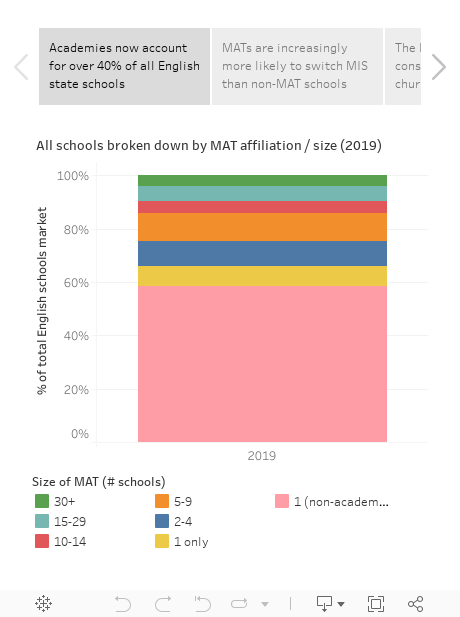
It is now clear that MATs are at the forefront of school MIS switching. Moreover, the larger the MAT, the more likely you are to switch. Take this nugget: the 846 schools in MATs with 30+ schools represent under 4% of all English state schools, but over the past term they represented 36% of all school switchers. That's a 9% churn for the "largest MATS" segment rate IN ONE TERM!
And if you think I've cherry-picked my data to make the trend look more pronounced than it really is, try this: over the past 3 and a third years, 377 of those 846 schools have switched MIS, equivalent to a churn rate of 13.3% per annum. That's 45% of ALL the schools in the largest MATs over the period switching their MIS! When you consider that over that same timeframe the non-academy churn was 2.2% per annum, you get a sense of just how proactive the largest MATs have been at switching compared to other schools.
Anyway, it's fun to be able to explore the data for yourself, so here are the visualisations I think say the most about where the market is right now...
Here are a few further thoughts on what those vizzes show:
- 10+ school MATs dramatically outswitch smaller MATs and standalone academies / non-academies. They represent just 15% of all schools but a third of all switchers over the past 3 and a third years. That makes sense to me - once you have 10+ schools, you're more likely to have a COO or procurement lead who'll like the six (or even seven) figure savings that can be achieved over a contract period by switching MIS.
- Churn rates are likely to increase in the coming years. Given that a further expansion and consolidation of MATs is likely, and since larger MATs can signal the direction of the sector more broadly, the overall churn rate is also likely to increase.
- The larger the MAT, the less you see of SIMS. If you look at the fourth viz in the above set, you'll see a chart showing vendor market share from 2014 onwards, segmented by MAT size. I've set the default to exclude non-MAT schools, and you can see that SIMS's market share has declined by 12 percentage point over the period with all MATs. Moreover, as you untick size categories (starting with the smallest), you notice that each time you do so the SIMS market share drops. For the largest MATs their market share is barely half of schools.
- Then again, SIMS market share hasn't budged one bit if you count by pupil numbers. Before anyone gets giddy about those rates of change, take a look at the penultimate viz in the set. You'll see that when the market is measured by pupil numbers, in 2010 SIMS had a market share of 81.06%, whereas in Jan 2019 their market share had moved on to (*checks notes*)... 81.06%. How have they managed this? Well, their decline is predominantly with primaries, where their market share has dropped from 82% to 76% of all schools. However, over that period they've actually grown their secondary share from 80% to 89% (largely at the expense of Advance Learning, whose CMIS product has consistently lost share over that period). On which note...
- The primary MIS market is now pretty competitive... RM, Scholarpack, Arbor, Pupil Asset, Advanced Learning and Bromcom all have c. 1%+ of the primary market, and together they share a quarter of all schools. What's more, when primary schools have switched over the past 16 months, over three quarters have been moving away from SIMS. That's important, because for the challengers it means any increase in churn will likely equate to an equivalent net increase for them.
- ...Secondaries, not so much. SIMS's (89% of secondaries) has just two serious competitors as things stand: Advanced Learning (4.7%) and Bromcom (4.5%). Furthermore, with Advanced losing share every year for the past decade (down from 17.6% in 2010), it's really only Bromcom eating into their totals to date. That may change - Arbor's CEO tweeted at me recently to point out they now work with 73 secondary schools, and it seems clear their ambitions are to make a much bigger dent in that market. But based on the available data, if you're a secondary, you're probably sticking with SIMS for now.
NOTE: In my day job with Assembly (now a Groupcall company), we're friends and partners of all MIS vendors in some way. However, we don't see it as our place to "pick winners" when it comes to school MIS selection, so my aim with this blog is to present data objectively to increase market understanding.