Pages

Monday, 3 February 2020

What the US can tell us about how mature SIS markets behave

This is part two in a series of two blogs written by Justin Menard and me using each other's datasets. His blog last week examined customer migration in the UK. This blog will look at what the north American market can tell us about how markets evolve. But before I get stuck in, let me quickly explain who we are and what we're up to.

I blog about UK Management Information Systems (MIS). Justin does the same for the US (where the same product is referred to as the School Information System, or SIS). That said, there are some key differences between us: 

  • Justin has to work harder to collate his data because I just use stats released by the government following freedom of information requests, whereas Justin has to collate his using all kinds of clever techniques.
  • Justin also covers other products (like the LMS) and countries (so many countries), whereas I'm a one-trick, UK-focused MIS pony. 
  • Justin has been far-sighted enough to turn his work into a thriving market insights company, called LISTedTECH whereas I just... blog for fun? 
What I'm saying is: Justin is who I want to be when I grow up. 

(I'm 41.)

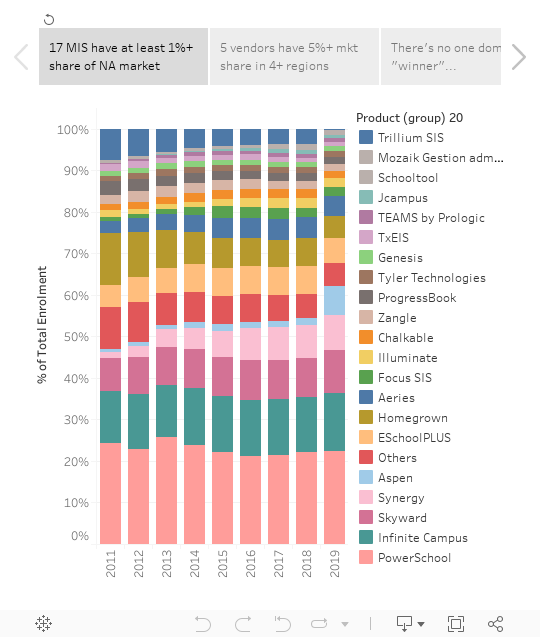
Aaanyway, back to me. I've created a Tableau Story in the same house style I use to blog about the English market, but using Justin's North American data source. As always, I'll give you the interactive graphs first, then you'll find my analysis below...

So what can we see?

  1. A mature market probably doesn't include a single dominant vendor. In England, there's a big beast called SIMS, owned by Capita, with 75% market share. That's down from 84% in 2012, but still, you know, three quarters of a market is a lot. In North America, however, it's a very different story. As the viz on the first tab above shows, no vendor has managed to claim more than around 25% of the North American market in any year (Powerschool had 25.8% in 2013). Now, it's true that North America is a more competitive market than the UK, with over 30 vendors boasting 100,000+ pupils within their districts, compared to just seven or eight vendors with that scale in England. But still: the trend in the past few years has been towards a more mature market, with greater competition for SIMS's crown, and the North American data suggests that may well continue.  
  2. That said, there's still space for local champions with majority market share. As my second viz shows, North America has notable variations at regional level. This is particularly true in Canada, where no region has more than four meaningfully-sized vendors, but it's also noteworthy that no more than seven or eight vendors compete in each of the three southern USA regions. We see similar patterns in the UK, where areas like Scotland and Northern Ireland basically procure a single system for the whole country. Also, even in competitive markets like England, regional champions have emerged, either via local authority group procurement, or (more recently) solid organic growth for local options like Pupil Asset in Norfolk. 
  3. It's quite hard to grow (or shrink) by more than 1 percentage point in a year. I mean you can... but to do so you're probably going to have to win (or lose) one very large contract, and there ain't many of those around. In North America, the biggest win of the past decade appears to be Aspen recently taking central Canada from Trillium, taking their overall North American market from 1.7% to 7.1%. But that's really the only move of anything like that magnitude I can find - and it followed eight years of steady decline for Trillium. In terms of what that says for the UK, it may make SIMS nervous about their ability to hold on to the Northern-Ireland-wide contract they've held for as long as I can remember. Or, to put it another way, just because you've locked down a market for a long time, it doesn't mean you'll keep it forever, particularly if your product trend-line is already downwards.
  4. It's hard to differentiate yourself in a mature market. My third viz shows the % of "won" contracts in a given year, and my main takeaway is "meh, nobody's really dominating the wins". My hunch is that this is a byproduct of how hard it is to differentiate yourself as a SIS. I once sat in a procurement beauty parade where the CEO of the commissioning group said to the vendor I was accompanying: "I've seen the red one and the blue one; now I'm talking to the white one. Tell me why I should remember anything else that's different about you?" The salesperson did a valiant job of responding, but honestly I wasn't convinced the CEO would remember the difference afterwards. Now, to be clear, I think there are meaningful differences between vendors, but I'm a nerdy market-watcher, and most commissioners aren't. So other than cloud vs non-cloud (yes, our dominant vendor in the UK is still locally hosted!), the data suggests that it's really hard to craft a marketing message that will win you more than a quarter of the available switchers.
  5. It's ok to be smaller, but you don't want to be one of the smallest. My fourth viz shows the losses by year, and what struck me was that the largest group in most years is "others". What this tells us is that the smallest vendors have struggled to hold on to their schools. I've given a vendor their own colour / segment if they have c.250,000 students (which is more or less the top 20 vendors in the market). In 2018 those 20 held data for 36m students, whereas the remaining long tail shared under 3m students. However, those smaller vendors represented fully one third of the losses in the year. My conclusion from this is that further consolidation - both in the UK and in the US - is likely. If you're a smaller vendor, you'll be looking nervously at the budgets and marketing clout of the bigger vendors, and every loss could feel like a threat to your survival. And equally, from the other side, those larger players may well be attracted by acquiring a ready-made chunk of market share in one go. Like I say, it's really hard to grow by even 1%, so if you can buy - say - half a percent of market share in one acquisition, it'll make a meaningful difference to your scale.

Finally, some brief notes and observations:

  • Justin's dataset is district-based, whereas my normal dataset is at the school level.
  • I've focused on % market share when visualising data as opposed to actual student numbers, because Justin has increased his national data collection coverage in every year, so the raw totals wouldn't necessarily offer a good like-for-like comparison.
  • As Justin pointed out in his blog, none of the US vendors has a UK presence. That's pretty wild when you consider how much edtech software does work both sides of the Atlantic.

For any questions about the data used for the graphs in this post, or to find out about subscribing to LISTedTECH's range of reports, please contact Justin use their website.

Monday, 27 January 2020

GUEST BLOG: Historical K12 SIS Customer Migration In The United Kingdom

You know what's a good feeling if you're a niche school data blogger? When people you admire agree to do reciprocal guest blogs with you, that's what! Which is a roundabout way of saying that Justin Menard, the Canada-based founder of LISTedTECH, has written the the following very cool piece about the English SIS market, and allowed me to post it here (you'll also find a copy on his blog). He has a way of visualising the movement of customers from legacy to new solutions that I think you're going to like - it helped me discover things I hadn't noticed before.

LISTedTECH measures and tracks systems used in educational institutions throughout the world - check out their website for more information. But for now, read on...
Back in November, I got the chance to meet Joshua Perry, writer of the “Bring more data” blog. Joshua has been following the Management Information System (MIS) used in the UK K12 market. Have a look at some of his posts http://bringmoredata.blogspot.com.
After discussing our mutual interests in educational systems’ market trends, we thought it could be interesting for the two of us to swap data and write a post using the other’s data. So this is my attempt.
Joshua's data is very granular. LISTedTECH looks at K12 data from the school district level, while he looks at it from the school level (using governmental data).
I created four historical graphs (2010-2014 to 2015-2019) of primary vs secondary level trends where every line represents a school. The left side shows the previous campus Student Informations System (SIS), measured by the number of institutions, and the right side shows the new SIS.
A few observations:
Primary level
  • Pearson e1, followed by SIMS, lost the most customers in the 2010-14 timeline.
  • SIMS, followed by Advanced Learning, lost the most customers in the 2015-19 timeline.
  • SIMS had the biggest customer increase in the 2010-14 timeline. However, they not only lost this advantage in the 2015-19 timeline, they actually came last as uptake in customers.
  • Overall, ScholarPack, RM Integris, and Arbor are the three companies with the most new customers within the 2015-19 time frame.
Secondary level
  • SIMS and RM Integris had the biggest customer increase in the 2010-14 timeline.
  • Advance Learning, followed by SIMS, lost the most customers in the 2010-14 and 2015-19 timelines.
  • Overall, SIMS and Bromcom are the two companies with the most new customers within the 2015-19 time frame.


Another interesting tidbit is that the systems used in the UK are completely different - as in I don’t recognize a single system used in the UK that would be used in North America.
A PDF version is available to help you zoom into the graphs.
For any questions about the data used for the graphs in this post, please contact Joshua Perry, writer of “Bring more data”.

Wednesday, 11 December 2019

UPDATED: 2019 election night - compare results to polls / 2017 election

(Updated on 11th December at 10pm to include 2017 GE election results)

I find that one helpful thing to do when watching election night coverage is to compare the results as they come in to the final (or most authoritative) poll. The networks don't really focus on that analysis; instead, they show you the swing from the last election, which is important, obvs, but not representative of where perceptions are on the night in terms of expectations of the likely result.

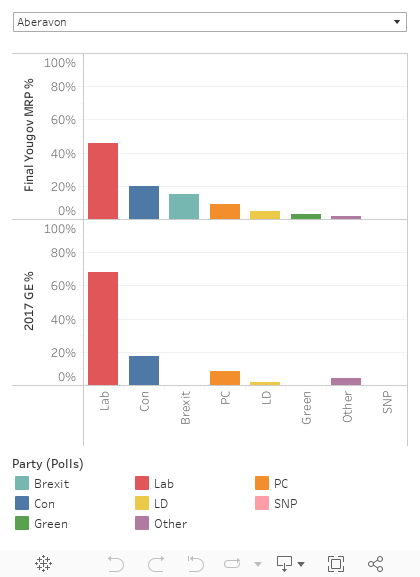
So I've made this Tableau tool, which allows you to look up a constituency's predicted vote shares from the second and final Yougov MRP poll alongside the 2017 General Election election results.


Thursday, 5 December 2019

MIS MARKET MOVES 2019: the challengers are slowly but steadily catching up

If you've found your way to my blog, you're almost certainly here for in-depth Management Information System (MIS) market analysis accompanied by whizzy graphs, and almost certainly not here for whimsical stories about random encounters in a veterinary surgeon's office in Lausanne.

But tough luck, because something bonkers happened to me yesterday in just that setting, and it's way more relevant to this blog than you'd imagine. So, if you haven't already, pause your excitement to find out about this year's market stats, check out this Twitter thread, and then come back here to read on....

[...]

Oh good, you're back. That was nuts, right?

Anyway, a brief headline of this year's stats is: yep, SIMS is continuing to decline, but nope, it's not happening as quickly as some vendors and commentators have been claiming.

Let's start with churn, since it's frankly the most important metric for understanding the pace of change in the market. Here are three charts that tell you what you need to know (commentary below):


Taking the charts in order:
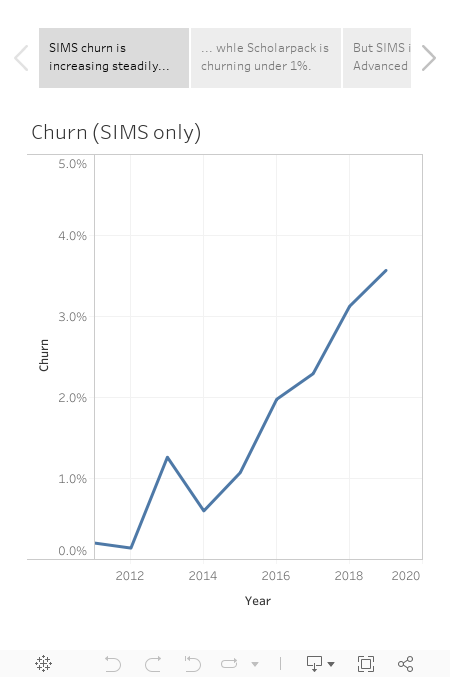
  1. SIMS churned 3.6% of its school customers in 18/19, up from 3.1% in 17/18. Bear in mind also that this is the culmination of a steady uptick since 2014, when churn was just 0.6%. That's no doubt cause for concern in SIMS Towers, but given some people have been whispering predictions well in excess of this, it's by no means (yet) a sign of precipitous decline. 
  2. What you can see though, is that the market is inexorably changing in favour of the challenger MIS. The top two vendors (SIMS and RM Integris) churned 3.6% and 4.1% respectively, whereas the third (Scholarpack) is churning at under 1%.
  3. However, let's not get carried away. The third chart shows Advanced Learning's churn set against that of SIMS. Advanced are something of a parable of what not to do in MIS-land: they have declined from 1,380 schools in 2010 to just 357 today. (Note to self: the story of why that happened is in itself worth a blog someday.) Things looked fine for them in 2011, when they churned just 2.2% - but the canary in the mineshaft came in 2012 when churn jumped to 7%. It rose to over 10% in 2014, and it has been between 10% and 37% ever since. 
Or, to put it another way, the data implies that mature MIS can churn up to perhaps 5% and just about hold their own. So I'll sound the alarm for SIMS if and when that number gets above the 5% threshold.

OK, now let's move to the market more broadly. Here are a bunch more graphs (again, with analysis below):


You'll see from these that:

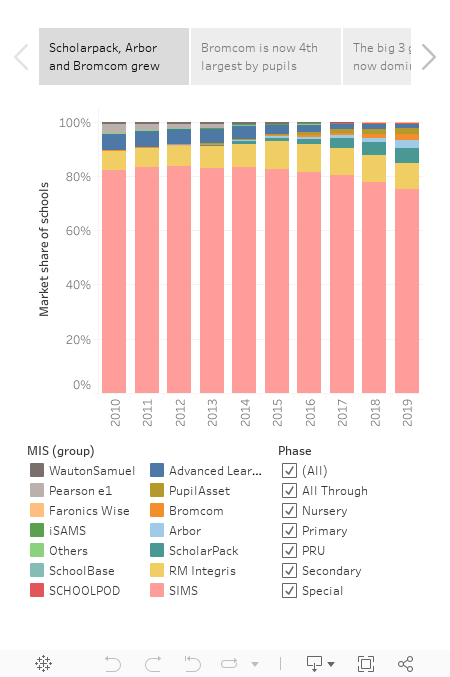
  1. SIMS market share is now at 75.1%, down from 77.8% last year when measured in terms of the number of school customers. (The decline is smaller than their churn because they won some schools too.)
  2. RM Integris remains in a clear second place, but also dropped a little (from 2,175 to 2,127 schools), giving further ground to the approaching pack.
  3. Arbor, Bromcom and Scholarpack all continue to gain, with each being able to claim an important distinction. Arbor grew fastest overall, notching up 277 switchers. Bromcom did best best amongst secondaries for the second year running (which also translates into a greater market share when measured by pupils). And Scholarpack remains the biggest of the three challengers on all measures, with 1,233 schools (5.6% market share by schools; 3.8% by pupils).
  4. Pupil Asset and Schoolpod stayed solid, without matching the gains of the other challengers. Pupil Asset grew the most, from 410 to 447 schools, and Schoolpod was more or less static at 134 schools vs 131 last year.
  5. SIMS's losses still are mostly primary-focused, though it's notable that they lost almost twice the number of secondaries in 2019 as they have done in any other year (53, compared to the previous high of 29 in 2018).
  6. Advanced continue to have a rough time. They gained just 10 schools in the year - the lowest of all MIS who won any schools, and lost 46. They're now the 7th largest MIS in terms of the number of school customers (357 vs 397 in 2018). 
  7. Nobody else is making a dent. iSAMS and SchoolBase held on to their handful of schools (they're both much bigger with private schools, mind), and Faronics are still there with one school customer. But nobody else is making a significant dent on the market, and it'll be jolly hard for anyone else to break in to the market now, given the years of hard work it took Arbor, Bromcom and Scholarpack to build their current momentum.

Right, that's enough for now. I may play around with a bit of additional analysis between now and Christmas, so keep an eye out if you'd like to hear more. Ideas are welcome!

Oh, and I recently left Assembly (my day job until earlier this month), and instead I am now:
  1. Starting a new schools venture (we're launching in January - watch this space).
  2. Representing Aircury, an awesome edtech software development agency.  
  3. Doing bits and bobs of advisory work. 
So, if you are struggling to resource your development needs, let's talk! Or, you're a MIS vendor and you'd like additional analysis, get in touch! Or, if you're an investor considering the market, hey, give me a shout! Or if you're a Multi Academy Trust considering what MIS to buy, cool, let's chat! (In the case of MATs I don't normally charge unless there's specific a need for lots of assistance - mainly I just enjoy gossiping about MIS....)

A final disclaimer: while I now have a few friends and/or clients who work for MIS vendors, I always aim to write this blog from a neutral perspective. As such, I generally avoid predictions, and instead focus on relating insights derived from the data. 

Wednesday, 31 July 2019

MIS switching picked up in the spring term. Arbor, ScholarPack and Bromcom led the way.

This is a quick blog update as I've just received the school summer census MIS numbers, and  there are some interesting points to note. But also... it's barely any time since my previous post based on the Spring census, so I'm not indulge in all the normal Tableau whistles and bells.

Instead, here are the headlines. Between the 2019 Spring and Summer censuses:

  • 420 schools switched MIS. That's a lot in historical terms for one term - and more than switched in an entire academic year between 2010-11 and 2013-14. 
  • 613 schools have switched so far this year. Last year 860 schools switched - itself the highest for a decade - and 2018-19 now looks on track to beat this.
  • Arbor, ScholarPack and Bromcom all did well. Arbor had the most switchers (125), followed closely by ScholarPack (115) and Bromcom (99). However, if you measure switching by pupil numbers, Bromcom was out in front (46,769 new pupils), followed by Arbor (34,790) and ScholarPack (28,008). 
  • SIMS lost 350 schools - a 2.1% churn. To put this in context, that figure (for one term) is higher than their churn in any full year over the past decade with the exception of 2017-18, when they churned 2.9%. Moreover, in the two terms of 2019 combined they've already churned 2.9%, meaning they're on track for another year of increased churn. Their market share (by number of schools) is now 75.8%, down from 77.3%.
  • Arbor is now the fourth largest vendor by numbers of schools; Bromcom is fourth largest by pupil numbers. The pecking order by schools is now: SIMS (75.8%), RM Integris (9.7%), Scholarpack (5.5%), Arbor (2.5%), Pupil Asset (2.0%), Bromcom (2.0%), Advanced (1.7%), SchoolPod (0.6%). By pupil numbers it's SIMS (79.9%), RM Integris (7.0%), ScholarPack (3.7%), Bromcom (3.0%), Advanced (2.6%), Arbor (1.9%), Pupil Asset (1.1%), SchoolPod (0.4%).
Below are the tables showing the Spring and Summer census 2019 figures for the raw data aficionados out there. If you have any other questions, say hi on Twitter or LinkedIn.


Saturday, 13 July 2019

MIS MARKET MOVES: Large MATs Are Changing The Way Schools Buy MIS

I've spent the last couple of weeks playing with the latest (Jan 19 census) school MIS data. When I first tweeted about it my headline was "NOT MUCH CHANGED". That's because a relatively underwhelming 193 English schools switched MIS - so you'd be forgiven for assuming there isn't much happening in the market.

But then I decided to dig into the data and look at the effect of Multi Academy Trusts (MATs) on MIS commissioning, and I came across some eye-opening trends.

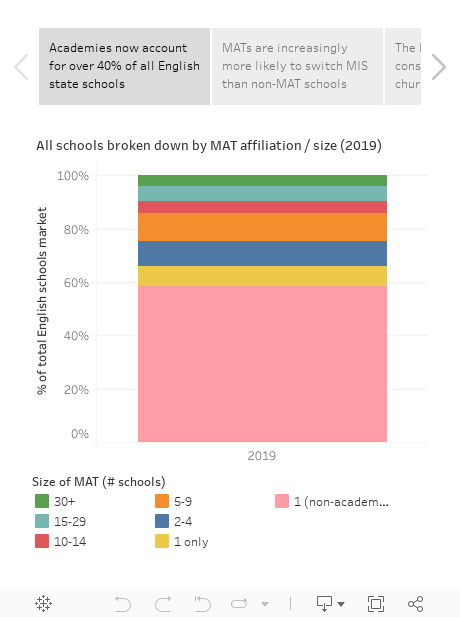
It is now clear that MATs are at the forefront of school MIS switching. Moreover, the larger the MAT, the more likely you are to switch. Take this nugget: the 846 schools in MATs with 30+ schools represent under 4% of all English state schools, but over the past term they represented 36% of all school switchers. That's a 9% churn for the "largest MATS" segment rate IN ONE TERM!

And if you think I've cherry-picked my data to make the trend look more pronounced than it really is, try this: over the past 3 and a third years, 377 of those 846 schools have switched MIS, equivalent to a churn rate of 13.3% per annum. That's 45% of ALL the schools in the largest MATs over the period switching their MIS! When you consider that over that same timeframe the non-academy churn was 2.2% per annum, you get a sense of just how proactive the largest MATs have been at switching compared to other schools.

Anyway, it's fun to be able to explore the data for yourself, so here are the visualisations I think say the most about where the market is right now...


Here are a few further thoughts on what those vizzes show:

  • 10+ school MATs dramatically outswitch smaller MATs and standalone academies / non-academies. They represent just 15% of all schools but a third of all switchers over the past 3 and a third years. That makes sense to me - once you have 10+ schools, you're more likely to have a  COO or procurement lead who'll like the six (or even seven) figure savings that can be achieved over a contract period by switching MIS. 
  • Churn rates are likely to increase in the coming years. Given that a further expansion and consolidation of MATs is likely, and since larger MATs can signal the direction of the sector more broadly, the overall churn rate is also likely to increase. 
  • The larger the MAT, the less you see of SIMS. If you look at the fourth viz in the above set, you'll see a chart showing vendor market share from 2014 onwards, segmented by MAT size. I've set the default to exclude non-MAT schools, and you can see that SIMS's market share has declined by 12 percentage point over the period with all MATs. Moreover, as you untick size categories (starting with the smallest), you notice that each time you do so the SIMS market share drops. For the largest MATs their market share is barely half of schools.
  • Then again, SIMS market share hasn't budged one bit if you count by pupil numbers. Before anyone gets giddy about those rates of change, take a look at the penultimate viz in the set. You'll see that when the market is measured by pupil numbers, in 2010 SIMS had a market share of 81.06%, whereas in Jan 2019 their market share had moved on to (*checks notes*)... 81.06%. How have they managed this? Well, their decline is predominantly with primaries, where their market share has dropped from 82% to 76% of all schools. However, over that period they've actually grown their secondary share from 80% to 89% (largely at the expense of Advance Learning, whose CMIS product has consistently lost share over that period). On which note... 
  • The primary MIS market is now pretty competitive... RM, Scholarpack, Arbor, Pupil Asset, Advanced Learning and Bromcom all have c. 1%+ of the primary market, and together they share a quarter of all schools. What's more, when primary schools have switched over the past 16 months, over three quarters have been moving away from SIMS. That's important, because for the challengers it means any increase in churn will likely equate to an equivalent net increase for them.
  • ...Secondaries, not so much. SIMS's (89% of secondaries) has just two serious competitors as things stand: Advanced Learning (4.7%) and Bromcom (4.5%). Furthermore, with Advanced losing share every year for the past decade (down from 17.6% in 2010), it's really only Bromcom eating into their totals to date. That may change - Arbor's CEO tweeted at me recently to point out they now work with 73 secondary schools, and it seems clear their ambitions are to make a much bigger dent in that market. But based on the available data, if you're a secondary, you're probably sticking with SIMS for now.

NOTE: In my day job with Assembly (now a Groupcall company), we're friends and partners of all  MIS vendors in some way. However, we don't see it as our place to "pick winners" when it comes to school MIS selection, so my aim with this blog is to present data objectively to increase market understanding. 

Wednesday, 22 May 2019

Here are nine shonky data practices that I've seen in schools. How many are you guilty of?

This Education Datalab tweet got me thinking.

It's a cracking exposé of sixteen (unnamed) schools which appear to have multiple students who are be on roll in autumn, off roll in spring and then on roll in summer. While we can't be certain of the intention, it seems highly likely that the goal is to exclude these students from the school's official KS4 accountability measures, since eligibility is based on pupils in Year 11 in the spring school census.

I tweeted this after reading the blog:
I stand by the sentiment, but ever since I've had the lingering sense that maybe we have all been complicit in something really silly that helps a school game data, wittingly or unwittingly. And maybe we'd all do that a bit less if, as well as condemning fairly obvious malpractice, we also pause and think about our own more subtle mistakes.

So in that spirit, here are nine shonky data practices I'm aware of. I'm mostly (and deliberately) drawing on things I've witnessed in schools that I've not been involved with directly - either as a member or staff or as a software supplier (I get to see a lot of schools so I'm lucky that way). And, for the avoidance of doubt, my former employer Ark had a great, self-reflective data culture. In the grey areas I talk about below I generally felt Ark were striving to do the right thing. But in any case, this isn't about shaming: it's about facing up to the things we could all do more to understand, or change...

Nine shonky data practices I've seen in schools
  1. EYFS results that are surely too good to be true. This may be more likely in new start schools - they only have one year group when they start, so there's extra focus on the data, and it's all Teacher Assessed (TA) data anyway and they're SO YOUNG and changing SO FAST so... somehow things get rounded up.
  2. KS1 TA results that are significantly more optimistic than the actual SATs papers taken at the same time. (For those that don't know, students sit KS1 exam papers, then schools basically throw those away and instead submit Teacher Assessed results. But that's an oddity for another day.) I once sat down with a head and talked through anonymised TA and scaled score data. If memory serves, there was one child was given a TA result lower than the SATs score implied. 17 were given higher TA results. Again, in my limited experience you're more likely to see this kind of thing in new start primaries or infant schools where KS1 is the ultimate outcome, so higher scores are good. Which brings me to...
  3. KS1 TA results that are significantly more pessimistic than the actual SATs papers taken at the same time. I once sat down with a highly impressive head of school who asked me how Ark handled KS1 results, because their schools submitted TA results on the pessimistic side. Basically their judgments were the mirror opposite of the case outlined in (2). This individual was claiming they were doing it to be "cautious", and  therefore somehow responsible, but then I looked at their progress scores and (surprise!) they do really well in that regard. So... why the need to be cautious? Just be as accurate as possible!
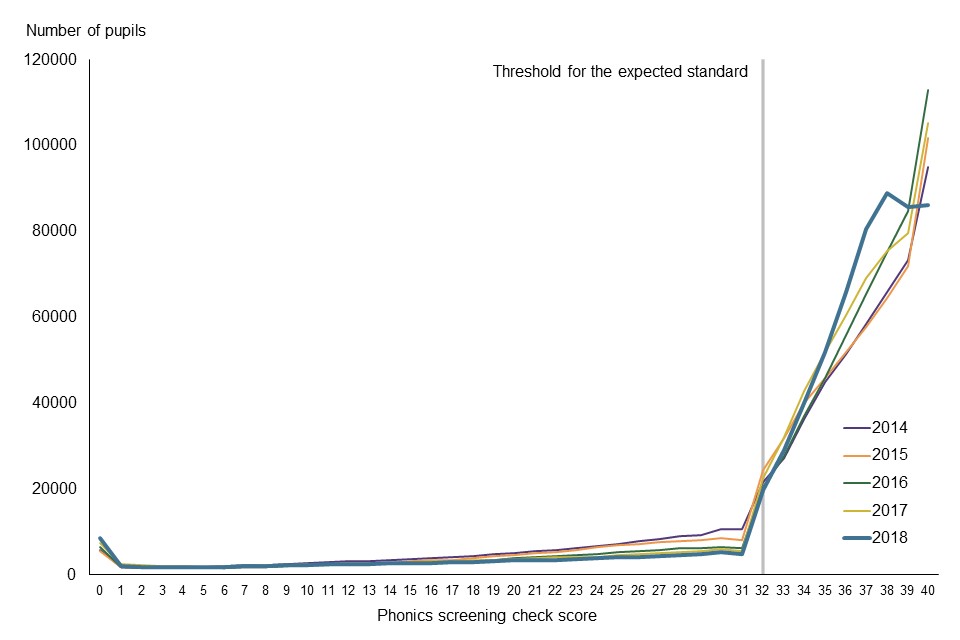
  4. Phonics results that follow this pattern. And that's... not how a distribution of results should look. In a national context it's easy to find it almost comical - but maybe it's also worth checking your own school's "curve" - and then see if you're still laughing when you realise how few of your students scored 31 (32 is usually the pass mark - and by now, schools have cottoned on.) 
  5. KS2 SATs results that seem to flatter the school. I've read about this more than I've seen it, and having never worked directly in a school I've never been involved in SATs invigilation, so I can't really put my finger on what it looks like when teachers help their students during the SATs exams. But, as this fascinating 2018 Schools Week article by the ever-excellent Laura McInerney explained, another Education Datalab study identified 30 schools where the pupils, "for whatever reason, do extremely well in their SATs exams and then bomb at secondary."
  6. Internal attainment data that looks ropey in autumn, better in spring and wonderful in summer. When schools report data from years that are not assessed statutorily, there is not always a way to sense-check what's being reported. But teachers may well be having their performance management based on their class's data. So it would make sense if the kids kind-of got better during the year, wouldn't it?
  7. Internal attainment data where the grades imply a common language but the teachers are clearly assessing differently. This is perhaps the most common - and innocent mistake. If you manage assessment across a MAT, it's hard to know whether every teacher is using the same methodology to arrive at an assessment. Even where there's a standardised assessment, some schools are probably getting the kids to sit in a hall, and others are just building the test into normal classroom practice. 
  8. Internal attainment data which looks good until the summer term of year 5 / year 10 then gets progressively worse during the "accountability" year. I've seen this multiple times now. I guess the cognitive bias is that people tend to be more likely to declare bad news when they're closer to the moment of reckoning.
  9. KS4 students who disappear from roll in the final year. The Education Datalab story highlighted a particularly cynical example of this, but the more common approach appears to be where a student just disappears from roll during the year, never to return. That's clearly bad for the life chances of the child in question - and accountability would seem to be a driving factor behind the behaviour.
This list isn't exhaustive, but there's hopefully enough there to make you reflect on your own experiences.

So what can we all do to be better? Well, if you're a governor, head, data manager or other school or MAT staff member, I'd suggest starting with the following:
  1. Read up. Look at any and all of the following:
    1. Making Good Progress by Daisy Christodoulou 
    2. Measuring Up by Daniel Koretz
    3. Every blog post Jamie Pembroke has ever written
    4. School-specific assessment courses from Evidence Based Education 
  2. Don't assume data you're presented with is correct. I mean, it may be of good quality, but take time to find that out. How has it been moderated? Were standardised assessments used for calibration? If it is test data, what conditions were the tests sat in? Are they working at grades or predictions? Is it even clear what the different between those two things is? This is particularly relevant for governors. I have to assume I'm not the only person who felt a bit useless in a governance role at some point. It's hard to know how to intervene effectively, and the head seems so... on it! Well, a few well placed and persistent questions about data accuracy can make all the difference. Keep asking about data reliability and process until you're confident everything is kosher. Ask to see any available correlations (e.g. TA vs KS1 SATs; internal assessments vs standardised assessments etc). Ask to see your phonics results graphed, so you can see whether a surprisingly large number of students just made the pass mark, while hardly anyone scored just below it. Make sure you know your off-rolling numbers and the reasons why students have been off-rolled. If people don't look happy that you're asking, take it as a sign that you're on to something until proven otherwise...
  3. Put a "commitment to accuracy" in your assessment policy. I know, it's just words. But I'm a believer in simple policies or statements (one page could be enough) to align behaviours. It only takes one sentence. Just say something like: "We will at all times aim for an accurate reflection of reality in our assessments, and will be vigilant never to skew our judgments positively or negatively to suit a perceived agenda". 
  4. Call bullshit. This is easy for me to say (because I'm not involved in running schools anymore) - but the leaders I've admired most on data do this even when they're in a position of accountability. The first person to show me that Phonics graph I mentioned in point 4 above (albeit a slightly earlier version) was Amanda Spielman, in an Ark meeting (we both worked there at the same time), as we grappled with whether to trust our own network's data. Daisy Christodoulou also led the charge for more honesty about whether our data could be more reliable at Ark, and her crystal-clear thinking led to the a move towards prioritisation of standardised assessments. Both were outstanding at calling bullshit. And hey, their careers seem to be working out ok... so don't be afraid to point out the nonsense and lobby for greater reliability!